If you lead or work in an ecommerce business, you probably feel like you’re working in a vacuum. You know your own store metrics and are constantly working to improve key metrics across the board.
But what are healthy ranges for these metrics? And how do you compare to the best in the business?
Vague industry benchmarks are useless. First of all, benchmarks are rapidly changing in the ecommerce world. Second, each business is different, and these benchmarks don’t give you insight into high-performing businesses versus ones that are barely surviving.
Every day, we work with influential brands on their DTC ecommerce strategies. Over the past 10 years, we’ve worked with hundreds of these brands, have direct insight into where healthy metrics should be, and get to see trends as they develop.
In this article, we’re going to give you the key metrics that drive a healthy, growing ecommerce channel and benchmarks to see how your brand is measuring up.
Prerequisites for Success
Before we get into the quantifiable numbers, let’s make sure we’re on the same page about what else is required for success.
Having all of the key metrics in the right place but not having some of the intangible qualities dialed in will mean you still can’t achieve success.
Here are some of the key prerequisites for success, aside from any metric.
Great Product
Every great business on the planet has a great product. This is the ante for playing in the game if you have any intention of winning.
You don’t succeed by having a great product and nothing else, but you definitely can’t succeed without it. Make sure your product not only fulfills its promise but also exceeds customer expectations.
Great Story
All brands that experience viral growth have a great story. From global giants like Starbucks and Southwest to fast-growing brands like Tony Robbins, Dr. Axe, Groove Life, and Native Deodorant, they all have a compelling story.
Remember, people buy based on emotion, not logic alone. Great brand stories create an emotional connection with your audience, turning them into raving fans.
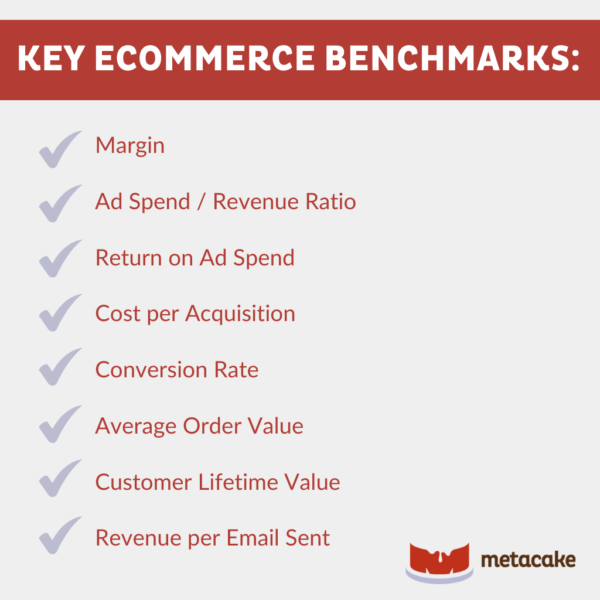
Key Ecommerce Business Benchmarks and Metric Goals
Now, getting into the true metrics, let’s look at benchmark ranges and metric goals to see how you stack up against healthy, successful brands.
For each metric, we’ll give you a benchmark that represents a healthy, growing ecommerce brand.
Margin
The product margin is the gasoline in the tank. It measures the profitability of your products after accounting for costs, making it one of the most important metrics.
If your product margins aren’t healthy, they can’t support your marketing efforts to grow your company. Only with strong product margins can you invest in great marketing and offer excellent customer service.
The minimum product margin you should have is 5x. It’s very hard to succeed otherwise (without heavy outside investment). For healthy explosive brands, the product margin is in the range of 30x, so make that your goal.
Benchmarks:
- Minimum product margin: 5x
- Product margin goal: 30x
Ad Spend / Revenue Ratio
While it’s good to look at each advertising channel individually, these channels don’t work in isolation. New customers will likely interact with your brand through several different channels prior to making their first purchase.
That’s why the next key metric is the total ad spend-to-revenue ratio, not per-channel revenue attribution. How much do you spend on ads, and how much do you make back in revenue? It’s simple.
In a healthy stage, the ad spend-to-revenue ratio should be as low as 35%–40%. In an aggressive growth stage, when you’re really grabbing to gain market share, the ad spend-to-revenue ratio could be as high as 55%.
Benchmarks:
- Growth phase: up to 55%
- Goal for healthy stage: 35–40%
Return on Ad Spend
Are you willing to break even or even lose on your first sale? This will vary depending on the stage of your business and your business model. Most healthy, growing brands break even at best on the first sale. This is because the true way to success is customer lifetime value.
For the sake of this benchmark, we’re looking at ROAS as an average for an entire channel, not for individual campaigns. Campaigns within each channel should be set up as funnels. Top-level campaigns will have a very low ROAS, while bottom-of-funnel campaigns will have an unusually high ROAS.
If you’d like to learn more about funnels, you can check out this article on how to make the most of your Facebook ads through funnels.
Viral brands at an early stage should have around an ROAS of 1. But be careful here. You can go out of business with an ROAS of 1 on new customers if your customer lifetime value is just a single purchase. Make sure that acquiring these new customers at no profit is part of your strategy for future revenue.
If you think that’s low, it’s not (unless you’re a well-established brand). If you’re relatively unknown, it takes investment before you see a return.
At a later stage, a healthy ROAS across the board for new customer acquisition is between 2 and 4.
Benchmarks:
- ROAS for growth phase: 0.5–1x
- Goal for healthy stage: 2–4x
Cost per Acquisition
Cost per acquisition, especially for new brands, will be very high. This is one of the main reasons you need to build strong product margins into your pricing. It allows you to support a high spend to acquire new customers (and still have a viable business model).
For products under $100, you should plan to spend $20–$40 to acquire new customers. This’ll vary a lot based on your product, and many brands will fall below this, but it’s better to plan for a high CPA.
Benchmarks:
- New customer acquisition: $20–$40
Conversion Rate
It’s most useful to look at conversion rates by channel and device to identify high growth and improvement opportunities. But your overall conversion rate should be no less than 2–3%. Anything below that is unhealthy and typically indicates that something’s wrong, either with your traffic or with your ecommerce experience.
If you’re interested in learning more about how to increase your ecommerce conversion rate, check out our full guide on conversion rate optimization.
Many viral brands have much higher conversion rates, around 6%. Conversion rates reach as high as 10% during promotions or sales.
Benchmarks:
- Resting conversion rate: 2–3%
- Viral conversion rate: 4–6%
- Conversion rate during promotional periods: 6%
Average Order Value
This metric calculates the average amount spent each time a customer places an order. There’s a lot of strategy that goes into increasing your average order value, starting with the product line.
Make sure you have enough products in your store and/or a reason for customers to buy multiple products in order to increase AOV. You also need a strong cross-sell/upsell strategy to incentivize higher-value purchases.
Benchmarks:
- Healthy AOV: 2.5x your average product price
Customer Lifetime Value
Your customer lifetime value is an essential component of your overall ecommerce business success. It estimates the total revenue a business can expect from a single customer over the duration of their relationship.
Viral brands have a lifetime value of around 2.5–3x AOV. The most successful brands with strong strategies for increasing lifetime value have CLVs even higher than this.
Benchmarks:
- Healthy CLV: 2.5–3x AOV
Revenue per Email Sent
Your email list is an asset. If nurtured properly, your email list will become a dependable source of revenue. The key is to build a relationship with your customers, providing value through your emails.
Not every email should be a hard sell.
How much money can you expect to make from each email sent? Healthy brands make between $0.10 and $0.20 per email.
If you want to learn more about how to create an email program that drives real revenue in the long term, check out our playbook on building a successful ecommerce email marketing program for your business.
Benchmarks:
- Revenue per email sent: $0.10
Final Thoughts: How Did You Measure Up?
If you’re not measuring up on some of these ecommerce benchmarks, it means you have some huge opportunities in your business. But you need to take action!
We’ve linked resources throughout this article to help you do that, and as always, never hesitate to reach out to us for a 15-minute discussion about your business. Our team is waiting.