We’ve spoken at length about the importance of running a data-driven company and we’ve shown you how to move from not using data to using data to drive decisions and achieve predictable business success. The availability of real-time data allows business owners and marketers to know right away which campaigns, site optimizations, or product launches are working and which or not. This is true even in a world where tracking is limited. While this presents a massive opportunity for predictable growth, many companies still don’t use data to make decisions. So why is that?
As we’ve discussed, most would agree that a balance between following intuition and data analytics is important when making business and marketing decisions. The challenge is knowing what data to look at, how to read it and interpret it properly, and how it plays into your company’s unique formula for success. It can also be challenging for leaders to set their “hunches” (or more often, their ego) aside and let the data drive the decisions.
Wondering if the balance between intuition and data are out of alignment in your business?
In this post we’ll break down the characteristics of a data-driven company and show you 7 ways to know if you are using data correctly to create predictable, sustainable growth.
What does a data-driven company look like?
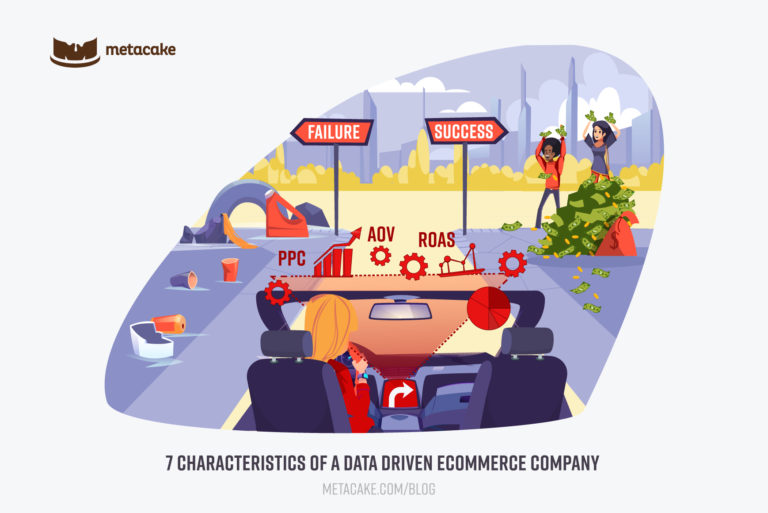
Before we dive into the real litmus test for data-driven companies, let’s start with seven characteristics of a company that’s utilizing data to its advantage:
- You know what metrics matter to your organization.
- You track those metrics in a simple fashion and review them every day.
- You can define where a metric needs to help achieve your business goals.
- You create initiatives to push each metric forward.
- All ideas and opinions are tested and compared against what data suggests.
- You learn from both successful and failed tests.
- You leave ego at the door because there is no place for ego in a data-driven team.
The 7 Key Metrics for Any Data-Driven Ecommerce Company
If you’re unsure about whether your company is truly data-driven or if it needs some work, here’s a litmus test.
Run through the metrics we list below. Do you know each of them off the top of your head? Are you actively making business and marketing decisions to improve each one? If not, you probably aren’t using data from your ecommerce site to the fullest potential, and these metrics should serve as a checklist to point you in the right direction.
1. Your ecommerce conversion rate (overall, by channel, and by device)
Your conversion rate informs just about every decision possible when it comes to site optimizations and marketing decisions. Your overall conversion rate is important, but it’s also important to be aware of how that breaks down by channel (paid search, paid social, direct, organic, etc.) and by device (desktop, mobile, tablet).
2. Your top converting marketing channel
Of all the advertising and marketing you are running, which marketing channel has the highest conversion rate and/or the greatest return on ad spend? It’s important to be acutely aware of what is “working” best for your business so you know what to scale and what needs attention.
3. Your AOV and where your AOV needs to be to reach your revenue goals
Average order value (AOV) is a key part of the ecommerce success equation. If you are running an ad-driven ecommerce company, there is a formula to ensure that you have enough revenue coming in from your ads to continue to support your ad spend and growth. AOV is a big part of that equation and it must be high enough to support the cost of customer acquisition.
4. Your ad spend to revenue ratio
Attribution has always been blurry and with changes to the way consumer data is tracked, it’s become even more complicated. Even before iOS14 updates that placed limits on what events Facebook and Google could track, customers touch so many different marketing channels in their journey. It’s rare that one singular channel drives the sale in isolation, so it is impossible to understand what channel should actually be credited with the sale. Of course, you can choose which attribution model you are going to use, whether that be first touch, last touch, or multi-touch. But none of those accurately show you which specific ad pushed the potential customer all the way through checkout. Only they know that.
With all of that in mind, the metric “ad spend to revenue ratio” gives us a high-level understanding of how all marketing channels work together. It’s a step back that looks at your overall ad spend on all marketing activities and your total revenue. As an ad-driven company, this needs to fall in a certain ratio for healthy growth. This is typically between 35-55%.
5. Your PPC ROAS
This one should be a given, but just in case—always be aware of your return on ad spend for any paid advertising you are running, whether that’s Facebook and Instagram ads, Google Search ads, YouTube ads, etc. Bonus points for your business if you know how that ROAS breaks down to new audiences vs retargeting audiences. As we mention in other posts, ROAS is not the end-all, be-all when it comes to measuring the effectiveness of your paid ad performance, but it’s still an important metric to be aware of.
6. Your desktop and mobile usage (and conversion) rates
Knowing what percent of your traffic uses desktop and what uses mobile and the conversion rates for each will inform what optimizations or improvements need to be made to your site.
If mobile is the majority of your traffic (which it likely is), are you designing for mobile first? Or are you simply adapting a desktop design to work for mobile? If mobile is the majority of your traffic (and especially if it’s the majority of your conversions as well), think mobile-first when designing both your ads and your site, and then adapt the designs to desktop.
7. Your revenue per email send
Do you know how much revenue your email marketing is generating? Or better yet, do you know how much revenue you’re generating relative to the number of emails you’re sending? It’s exciting to see that an email campaign generated $2,000 in sales. But it’s not as exciting if you realize that email was sent to 40,000 names. If you’re wondering how much revenue to generate for your list size, a good benchmark is about $0.10 per name that receives your email campaigns.
Take the next step: What is your data telling you?
Have you identified areas of your business where you’re relying more on gut-feelings than the story data is telling you? Start digging into that story, because data is how your customers speak to you. If you need assistance tracking or analyzing your store and marketing analytics, don’t hesitate to pull in the experts by contacting us below.